TutorialBest viewed on desktop

Systems Thinking for Testers

A practical starting point for exploring relationships, feedback, and unintended consequences in the systems we test.

Systems thinking is a holistic approach to problem solving.

What is a system?

In systems thinking, a system is a set of distinct elements or parts that are interconnected and work together to form a unified whole with a shared purpose. Crucially, there are no systems that are separate from other systems, they are all part of a larger system. You cannot understand a system by looking at pieces of it in isolation

What is not a system?

The example given by Donella Meadows in the book is a pile of sand by the road by happenstance. If the sand volume increases or decreases it does not have any function and the end result is more sand. The sand is not living and has no interconnections.

System field check

How do I identify a system?

  1. Can you identify parts?
  2. Do the parts affect each other?
  3. Do the parts together produce an effect that is different from each part on its own?
  4. Does the behaviour of that effect change over time, persisting in different circumstances?

Here is a simple system showing a population. There is one input: births. If a baby is born, the population increases. This is known as a reinforcing loop. A reinforcing loop increases the "stock" of a system, which in this example is the population. The output of this system is death, a balancing loop, a loop that lowers the stock. If someone dies, the population decreases. This system is very oversimplified, but it's a good way to be introduced to reinforcing loops (R) and balancing loops (B). All systems diagrams are simplifications of the real world.

Stock and flowA country's population
Population stock and flow diagramBirths flow into the population stock and form a reinforcing feedback loop. Deaths flow out of the population and form a balancing feedback loop.BirthsINPUTPopulationSTOCKDeathsOUTPUTRMore people can lead to more births++BDeaths reduce the population+

R marks reinforcing feedback; B marks balancing feedback.

Two-stock systemA rabbit population constrained by renewable grassland
Grassland and rabbit population two-stock diagramGrass biomass is a renewable stock increased by regrowth and reduced by grazing. Rabbit population is a second stock increased by births and reduced by deaths. More grass supports rabbit births, while more rabbits increase grazing pressure on the grass.Grass biomassRENEWABLE STOCKRabbitsPOPULATION STOCKRegrowthGrazingBirthsDeathsSunlight, rain and soil+++More food supports more births++More rabbits create more grazing pressureB

Grass can regrow, but not instantly. If the rabbit stock grows faster than the grass stock recovers, grazing reduces the food available and eventually constrains further population growth.

Goal-seeking systemA cup of coffee homes in on room temperature
Coffee temperature balancing-loop diagramTwo balancing feedback loops pull a cup of coffee towards room temperature. Coffee above room temperature releases heat and cools. Coffee below room temperature absorbs heat and warms.TARGETRoom temperatureCURRENT STATECoffee temperatureABOVE ROOM?Heat gapRESPONSEHeat released+BCOOLINGBELOW ROOM?Heat gapRESPONSEHeat absorbed+BWARMINGBoth balancing loops reduce the gap between the current state and the target.

This is a homing effect: the further the coffee is from room temperature, the stronger the corrective heat transfer. The response weakens as the temperature gap closes.

Change over timeObjects move towards room temperature
Ice and a hot drink changing temperature over timeA hot drink cools from 80 degrees Celsius towards a room temperature of 20 degrees. An ice cube remains near zero while melting, then the meltwater warms towards the same room temperature.80°60°40°20°0°TimeTemperature (°C)Room · 20°CHot drink · 80°CIce · 0°CMELTINGThermal equilibrium

The greater the temperature difference, the faster heat moves. As each object approaches the room's temperature, the rate of change slows.

System zooA pond ecosystem

This model shows a pond system with some fish inside it that is affected by multiple variables. On the left, water companies are letting wastewater runoff pollute the pond system. There is a buffer between the runoff and the pond, which should protect the pond to some extent. There is also the water temperature, which has an effect on the fish too. Move the values of the system variables and see how it affects the pond's ecosystem.

As explained in earlier sections, a systems diagram is always a simplified model of reality.

Change the system
Current statePond under pressure
Interactive pond ecosystemPond under pressure. Algae covers 44 percent of the pond, oxygen is at 62 percent, and modelled fish health is 63 percent.RunoffMore buffer filters runoff · more algae consumes oxygen
Algae coverage44%Oxygen level62%Fish health63%

Algae is expanding and using oxygen. A small input change could now have a larger effect.

This is a simplified teaching model. Its scores demonstrate relationships, thresholds, and combined effects rather than predict a real pond.

A story from practiceTesting a cooling-off notification

My team was building a web application for a client. During the new-business journey, the application collected a user's information. After 23 days, the client wanted an email to warn the customer that their cooling-off period was coming to an end.

The middleware responsible for this notification had several jobs. It needed to retrieve information from the database, send an API request that added a cooling-off document to the user's account, and trigger an email telling the customer that they had new correspondence.

It was difficult to keep the whole system in a stable state for long enough to perform this action. I therefore took a systems-thinking approach to understand why the middleware appeared to fail so often and how we could align all the subsystems before testing the document.

The system being testedSix conditions had to form one successful journey
  1. 01Elapsed time

    The customer had to reach day 23 of the cooling-off period.

  2. 02Customer data

    The database needed the correct journey and account information.

  3. 03Middleware

    The scheduled process had to find the customer and coordinate the work.

  4. 04Document API

    An API request had to add the cooling-off document to the account.

  5. 05Correspondence

    The updated account had to show that new correspondence was available.

  6. 06Email

    The notification service had to tell the customer about the correspondence.

Component question

Why does the middleware keep failing?

Systems question

What must be true across every subsystem at the same moment for the journey to succeed?

Taking a systems-thinking approach

The middleware could not be understood in isolation. A failed test might have been caused by its own behaviour, but it could also have come from time-dependent state, incomplete data, an unavailable API, an account update that had not completed, or a notification service that was not ready.

The testing problem was therefore to make the relationships visible: define the required state at each boundary, identify where that state could drift, and establish which conditions had to be controlled or observed before treating a failure as evidence of a middleware defect.

The lesson

A component can look unreliable when the wider system is misaligned. Systems thinking shifts the focus from one failing component to the timing, state, dependencies, and information flows that produce the end-to-end outcome.
Multiple perspectivesWhat is the pig model?
The Pig Model stakeholder-perspectives diagramA pig is viewed as food by a wolf, income by a farmer, inspiration by a poet, and a patient by a veterinarian. The diagram demonstrates how different stakeholders perceive the same system differently.SEEN BYWolfSEEN ASFoodSEEN BYFarmerSEEN ASIncomeSEEN BYPoetSEEN ASInspirationSEEN BYVeterinarianSEEN ASPatientTHE PIGOne thing, four stakeholders, four valid frames of reference.
Why use the Pig Model?

The Pig Model helps us see how the problem we are solving, or the system we are working with, is viewed by other stakeholders. Each perspective can reveal different needs, assumptions, risks, and definitions of success.

Adapted as an original illustration from the Government Office for Science systems-thinking toolkit, which credits the original example to Gareth Morgan.

Software exampleHow is an online checkout system seen?
Online checkout stakeholder-perspectives diagramAn online checkout is viewed as a quick and safe purchase by a shopper, revenue and conversion by a retailer, services and dependencies by a developer, and behaviour, risk, and evidence by a tester.SEEN BYShopperSEEN ASA quick, safe purchaseSEEN BYRetailerSEEN ASRevenue and conversionSEEN BYDeveloperSEEN ASServices, APIs and dependenciesSEEN BYTesterSEEN ASRisksONLINE CHECKOUTThe software is the same; the meaning, priorities, and boundaries change.

No single perspective is the complete system. Bringing these views together helps a team discover overlooked dependencies, conflicts, and quality expectations.

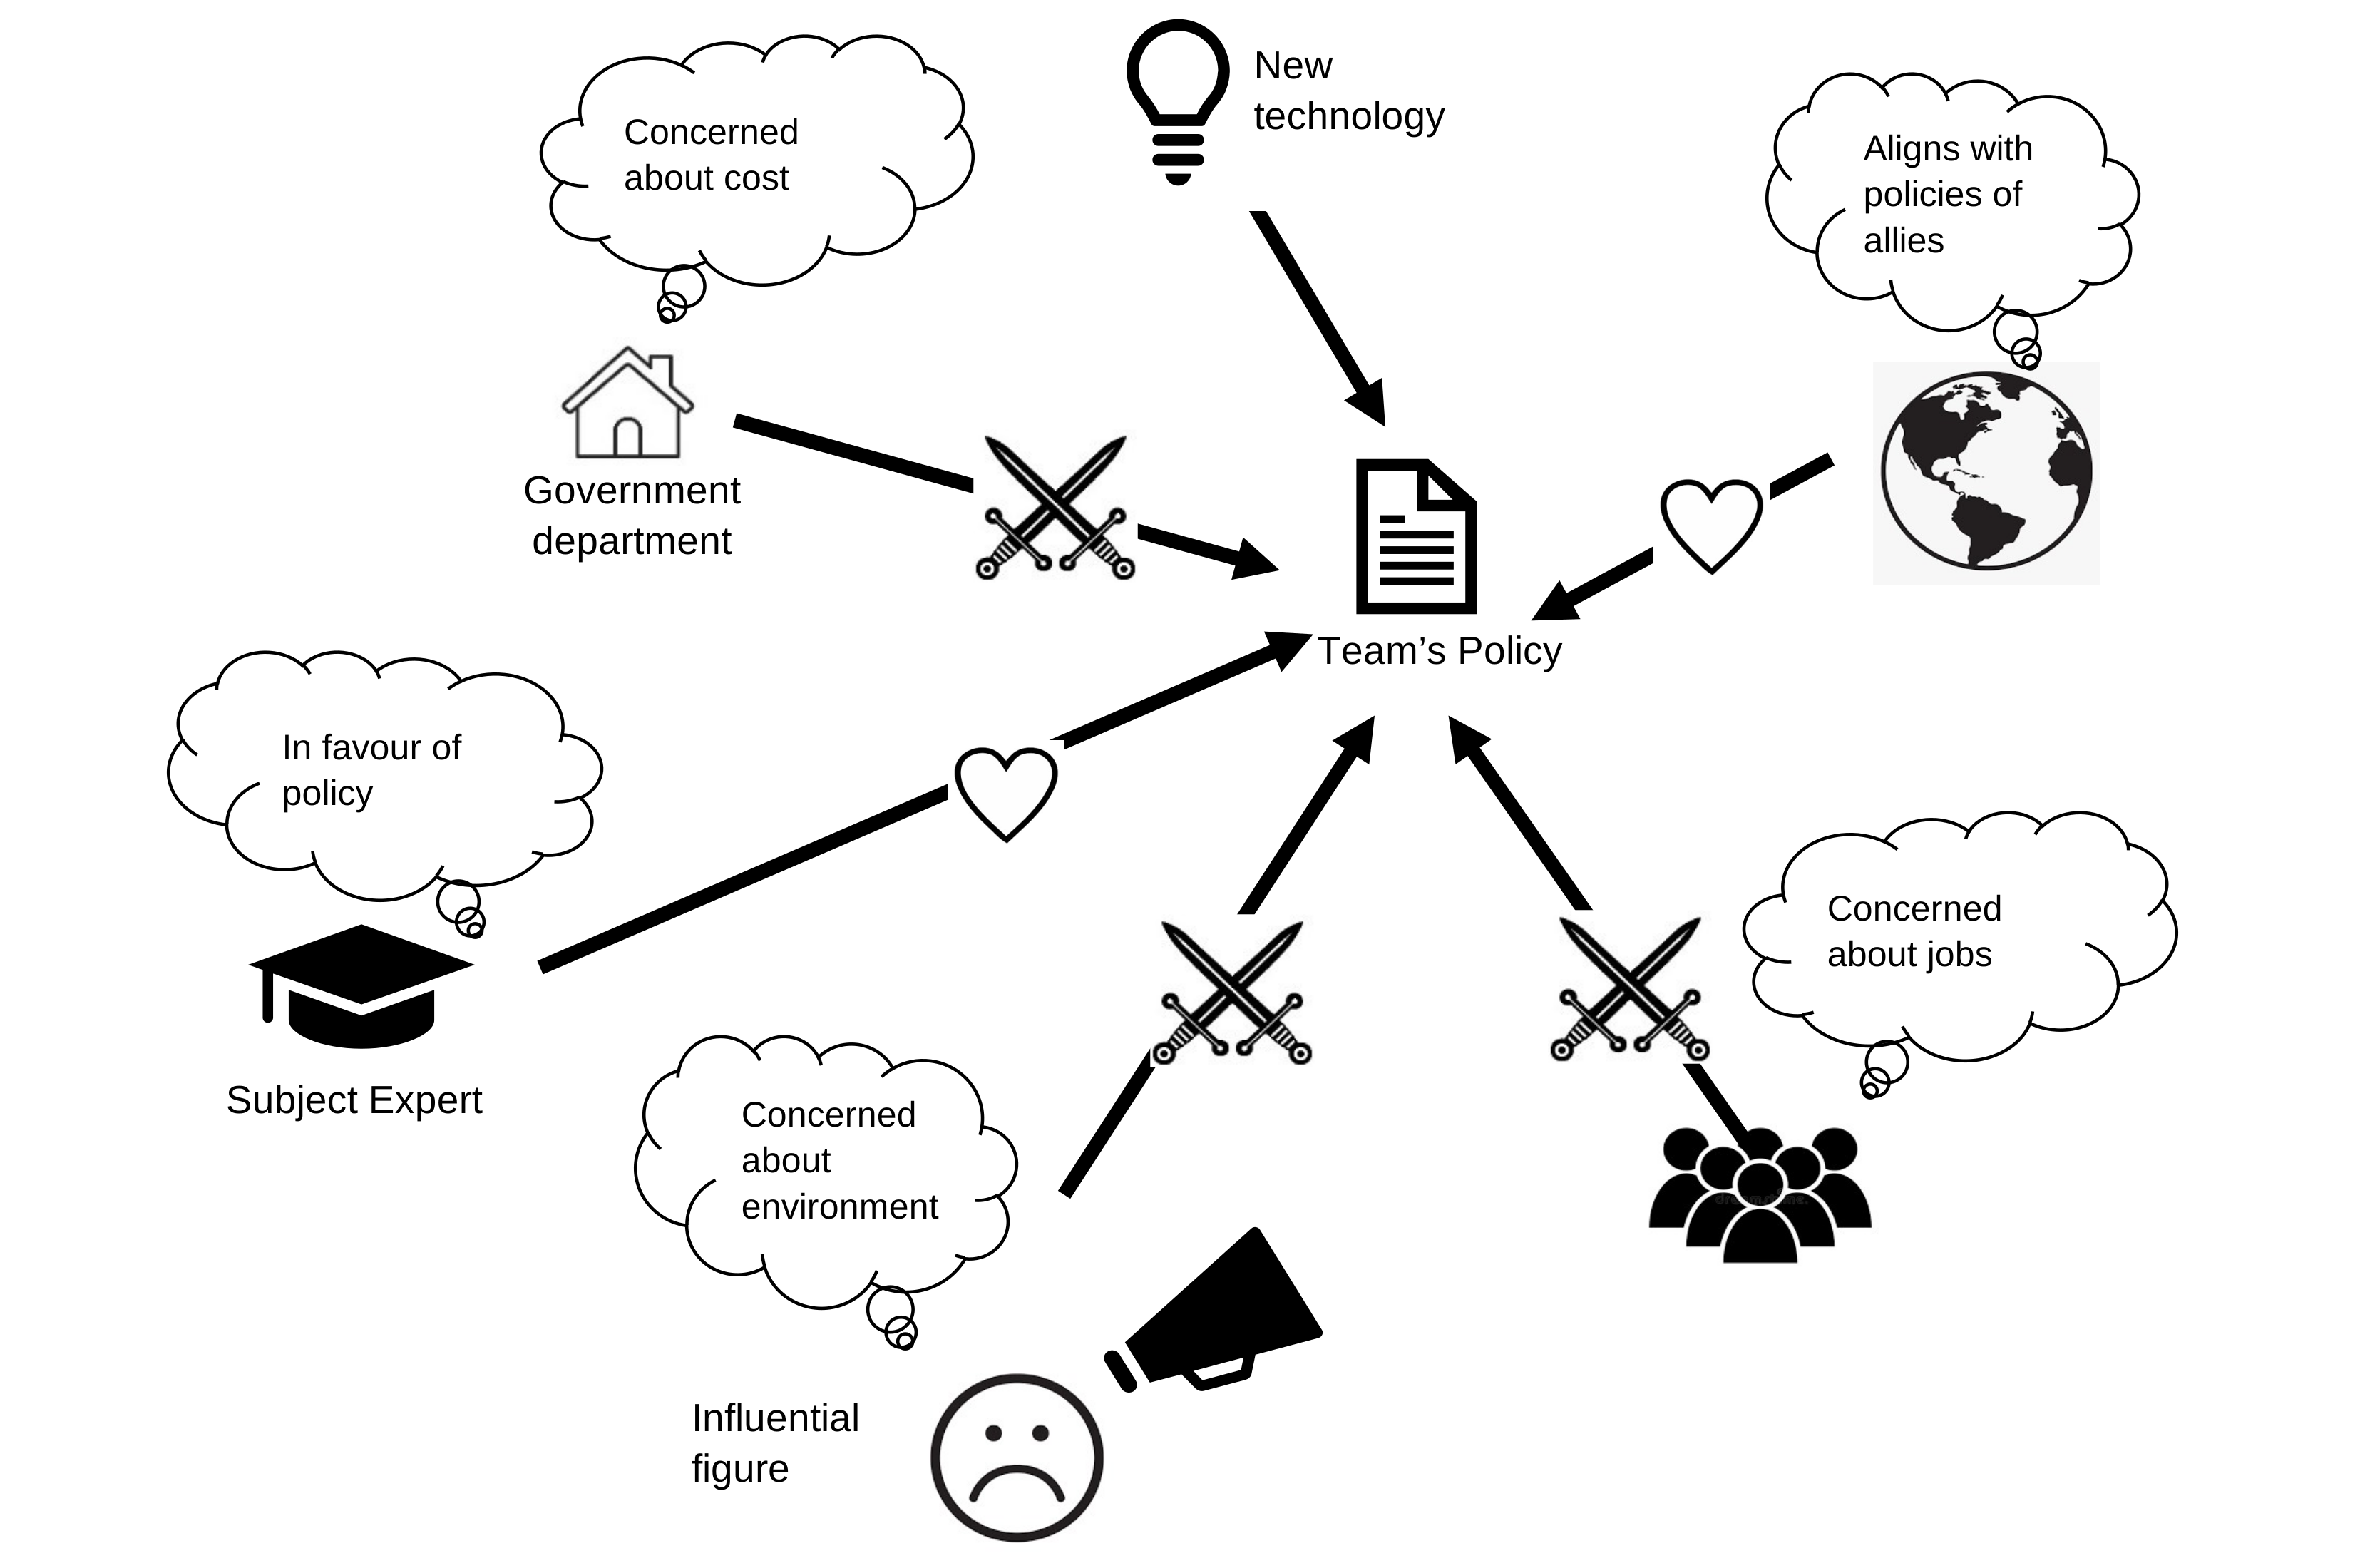
Worked exampleStakeholders and influences surrounding a new policy
Rich picture showing stakeholders, concerns, technology, public reactions, and relationships surrounding a new policy
What makes it a rich picture?

The drawing brings structures, relationships, opinions, concerns, conflicts, and external influences into one view. It is deliberately less formal than a process diagram: its purpose is to expose the complexity of the situation and start a conversation about what may be missing.

Source: Government Office for Science, An introductory systems thinking toolkit for civil servants, Figure 3. © Crown copyright 2023, licensed under the Open Government Licence v3.0.

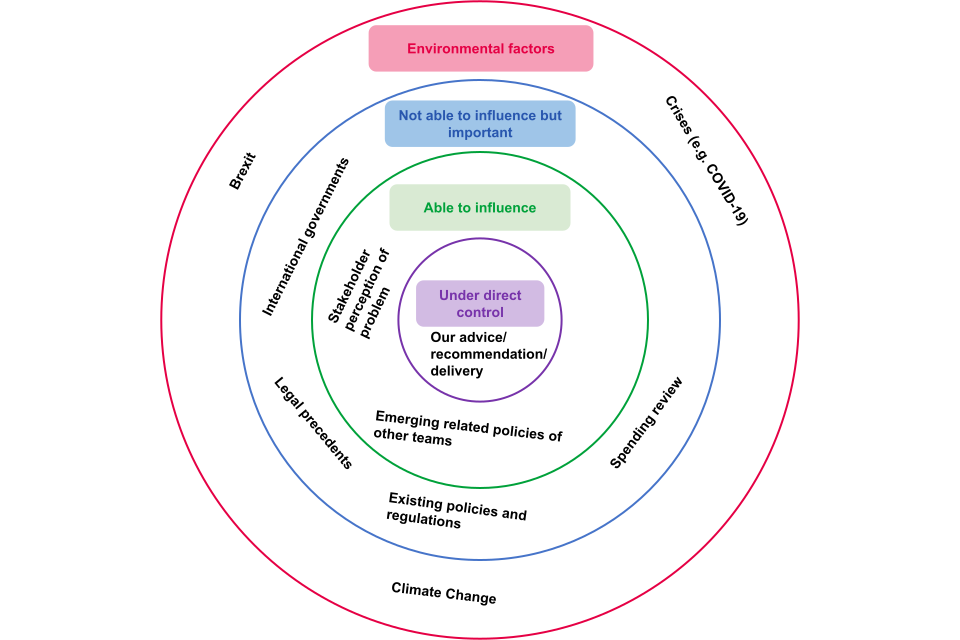
System boundariesWhat can the team control or influence?
Context diagram with nested boundaries for factors under direct control, able to influence, important but not influenceable, and wider environmental factors
How to read the boundaries

Start at the centre with the factors the team controls directly. Move outwards through factors it can influence, factors it cannot influence but must understand, and finally the wider environment. These boundaries help the team decide where to act, collaborate, monitor, or adapt.

Source: Government Office for Science, An introductory systems thinking toolkit for civil servants, Figure 6. © Crown copyright 2023, licensed under the Open Government Licence v3.0.

Systems often behave in surprising ways because of recurring structures beneath the events we can see. These six concepts help testers look beyond an immediate symptom and ask what is shaping the behaviour.

01Time

Delays

The effect of an action may arrive much later than the action itself. When teams cannot see that delay, they can intervene again too soon and create oscillation or instability.

02Decisions

Bounded rationality

People make reasonable decisions using the information, time, incentives, and mental models available to them. A locally sensible choice can still produce a poor result for the wider system.

03Capacity

Resilience

Resilience is a system's ability to absorb disruption, recover, and continue to fulfil its purpose. Diversity, spare capacity, feedback, and adaptable responses can all strengthen it.

04Feedback

Escalation

Escalation occurs when two actors react to one another through a reinforcing loop. Each response raises the pressure for the other side to respond again.

05Emergence

Self-organization

Order can emerge from many local interactions without a central controller. Simple rules, information flows, and relationships shape the patterns the system creates.

06Relationships

Non-linearity

Cause and effect are not always proportional. A small change can cross a threshold and create a large effect, while a large intervention may sometimes achieve very little.

Systems Thinking for Testers | Testing Throughout